What we know and don’t know
By: Maria Kelleher
Solid Waste & Recycling Magazine – 2007-04-01
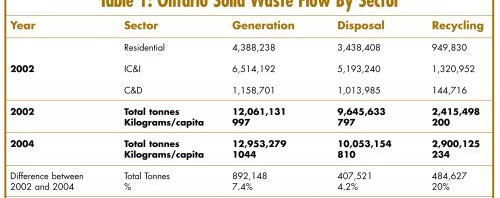
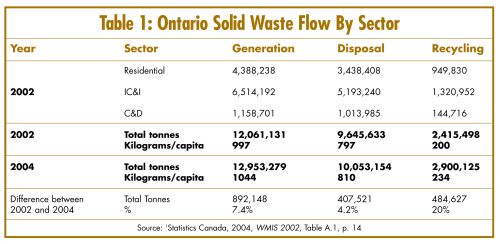
Statistics Canada undertakes a survey of the waste management industry every two years to identify the wastes managed by the public and the private sector. This is the only reliable survey that tracks the waste streams from the institutional, commercial and industrial (IC&I) and construction and demolition (C&D) sectors. The most recently published Statistics Canada solid waste generation, diversion and disposal data for Ontario (for 2002) are presented in Table 1. The table also presents the 2004 aggregated provincial totals.
The Ontario Waste Management Association (OWMA) concluded that considerable amounts of waste data are missed through the Statistics Canada bi-annual survey and commissioned a study of waste diversion in Ontario to identify sources of additional waste diversion not captured in the government data (as well as to gain a better understanding of current IC&I waste diversion activity). The study was carried out between July and December, 2006 and relied on literature reviews, website searches, OWMA member surveys and industry association surveys to collect the information.
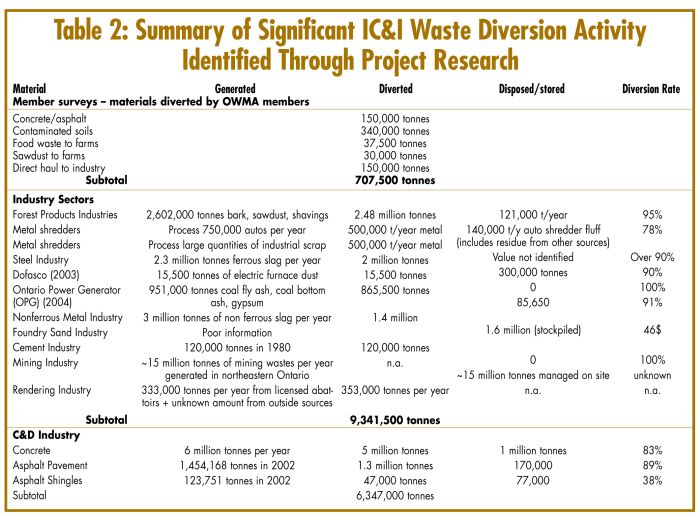
The Statistics Canada survey doesn’t capture waste diversion activities from the following industries or activities (also see Table 2, which shows IC&I waste that is diverted, in some cases, or could be, in other cases):
* Forest industry wastes reused onsite or by other industries (e.g., bark, sawdust, wood waste) for manufacturing into new products or thermal/electricity generation;
* Metal shredding wastes from white goods and auto hulks used as landfill cover;
* Steel industry wastes, such as ferrous slag used in construction and electric arc furnace dust used onsite;
* Coal fly ash and uncontaminated bottom ash from coal powered generating plants used in the manufacture of concrete and cement;
* Nonferrous metal industrial slag wastes used for sandblasting media and the manufacture of concrete;
* Reuse of cement industry wastes;
* Food and animal wastes from rendering plants used to make protein meals and fat products;
* Food wastes or other wastes sent to farms for use as animal feed or bedding;
* Food wastes from the food services industry sent to shelters or food banks; and,
* Reuse or recycling of C&D wastes such as concrete, asphalt and asphalt singles.
OWMA member surveys
Selected members of the OWMA were sent a survey in July 2006 requesting general information about their operations. Respondents managed the following materials:
* Collected 4,598,000 tonnes per year (tpy);
* Diverted through recycling — 1,108,000 tpy;
* Diverted through composting — 162,000 tpy;
* Diverted through other methods (e.g., farms, rendering facilities) — 170,000 tpy; and
* Disposed 5,190,000 tpy (166,000 tonnes may be double counted in this total), which includes material not collected by OWMA members.
When asked which industries could recycle more than current efforts or throw out a lot of material which could be recycled, the list included: retail sales; construction (multiple responses); restaurants (multiple responses); small businesses (multiple responses) and heavy manufacturing.
Industry association surveys
A survey was conducted of 32 industry associations to identify the extent to which non-hazardous solid waste recycling and composting was of interest to their memberships, and to assess general awareness of waste generation and composition by IC&I generators. Interestingly, the majority of associations representing groups of Ontario IC&I generators did not have a good sense of member efforts on waste diversion and, in particular, did not have specific quantities or estimates of the amount of waste produced or diverted by their industry in Ontario. When asked why some members participate in waste diversion activities, survey respondents identified several reasons. One is regulatory requirements (especially in regards to industries already familiar with hazardous waste and/or other regulatory requirements). Another is economic and cost-savings opportunities (for example, more effort will be taken to recover and recycle packaging items that have a high market value or which cost a great deal to dispose). Lastly there is just the nature of particular business operations.
One significant barrier to IC&I recycling appears to be the simple lack of recycling infrastructure. Other barriers include lack of incentives to recycle, and regulatory impediments (i.e., restrictions on waste transport and waste recovery definitions and constraints). Some associations expressed an interest in working with OWMA to compile waste generation, composition and diversion information. This opportunity will be pursued in 2007.
Conclusions
The study research has identified large amounts of IC&I diversion activity in Ontario which is likely not captured in the Statistics Canada bi-annual survey, although some double counting may be involved. People want to know what the real IC&I diversion rate is in Ontario? Intuitively, industry members believe it is higher than the 20 per cent reported in the Statistics Canada survey. However, identifying the actual IC&I diversion rate is difficult. Beyond being more than what’s indicated in the Statistics Canada survey, much of the diverted material was always diverted, and therefore represents a baseline which was always in place (and never consumed landfill capacity in Ontario). Examples of this type of material include metals which have always been recycled: up to one million tonnes through metal shredders plus additional amounts through scrap metal yards; two to four million tonnes of ferrous and non-ferrous slag; 330,000 tonnes or more of animal wastes; four million tonnes of concrete and millions of tonnes of asphalt.
It’s probably more accurate when talking about “diversion” to look at incremental diversion of materials that used to be landfilled and are now used for a variety of purposes (such as reuse, animal feed, power generation). This would include 340,000 tonnes of contaminated soil, 780,000 tonnes of ash from OPG coal generating stations, etc. Even in these cases, the previous handling practice for these materials needs to be identified to see if they were being disposed in landfills (which were covered in the Statistics Canada database) to avoid an “apples to oranges” comparison.
Regardless of the actual Ontario IC&I waste diversion rate, annual disposal capacity is still needed for 5.2 million tonnes of IC&I waste generated in Ontario. Additional practical diversion options and related infrastructure capacity needs to be found for this material.